This is a brief introduction to a vast subject. Technical analysis, as opposed to fundamental analysis, includes analyzing charts and technical indicators like RSI, MACD, moving averages, etc. It has its uses if the trader or investor is aware of its good and bad points.
Subscribers are encouraged to do more research into this technique before using it with your capital. Just like any other methods, it is useful to deeply understand its strength and weakness.
One weakness is that its interpretations can be affected if you draw the same charts on a different scale, i.e. arithmetic or semi-log scale. Another potential weakness is that the price and volume of a stock can be manipulated so as to give certain patterns or readings for the other traders.
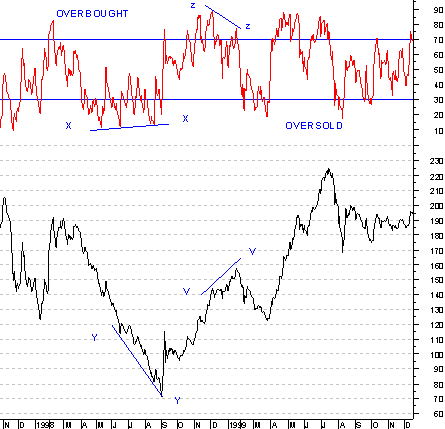
RSI Chart
This indicator is also very popular with traders in the future markets. Its formula is:
RSI = 100 - (100/(1 + rs))
Where rs = average of X day's up closes / average of X day's down closes.
The number of days can be varied. In our case we choose 9 days instead of the usual 14 days. The RSI can also be calculated on a weekly or monthly basis. The shorter the time, the more sensitive RSI becomes.
The maximum and minimum levels that the RSI indicator can theoretically go to are 100 and 0. Usually if the RSI is above 70, it is overbought and if it is below 30, it is oversold. These are useful for short-term traders.
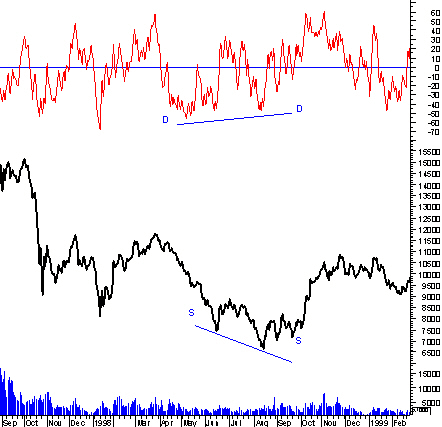
An important use of RSI is when there is a divergence between the company's price or a market index and its RSI. A "bullish divergence" signals a short-term bottom while a 'bearish divergence" signals a short-term peak.
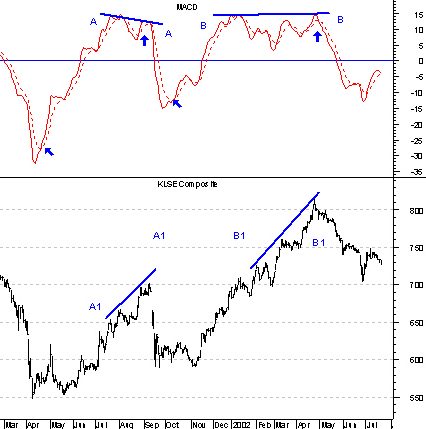
MACD Chart
The MACD trading method is actually based on 2 exponentially smoothed moving average and buy / sell signals are given when the 2 lines cross.
The MACD just like the RSI can also be calculated on a weekly or monthly basis. In addition, a divergence between the share price or a market index and its MACD is a powerful indicator of a reversal. It is also useful for short - term traders and should be used in conjunction with other indicators.
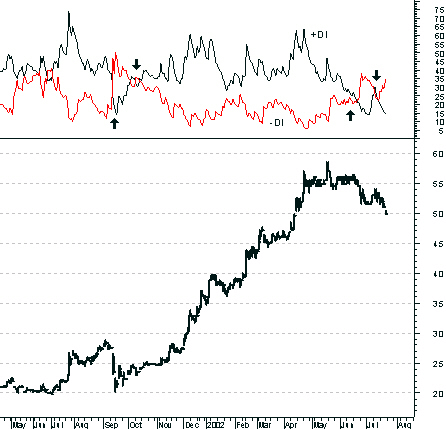
DMI Chart
Under this index, two lines are generated. Buy / Sell signals are again given when the 2 lines cross.
The signals given are, from our experience, longer term than the MACD or RSI.
Besides the above 3 technical indicators, there is a whole list of other technical indicators that a brief guide like this cannot cover. Stochastics, Demand Index, On - Balance Volume, Momentum, William's R, Advance Decline Line, etc are just examples of the many more that the ingenious human mind can think of. The bookshops have a wide range of books on such topics and subscribers are encouraged to buy some and work through them.
Technical analysis also includes analysis of chart patterns. Based on the simple premise that history repeats itself, the chart patterns created by the price movement are analysed. Exotic terms like Head and Shoulders, Double Top or Double Bottom, Flags, Triangles, Pennants, Trend lines, Resistance, Support and so on abound in the world of chart analysis. A key component of chart analysis is volume. Often, the chart patterns have to be confirmed by the underlying volume pattern. One reason why many have found chart and technical analysis attractive is its simplicity, especially with the advent of personal computers. Many are "seduced" by this and its sometimes remarkable accuracy. Experienced chartists and traders know that there is more to this and therefore incorporate the following key techniques into their trading strategies to improve their chances of sustained success.
The single most important concept that a successful technical analyst and trader must fully comprehend is probability. From this vital concept, the following trading strategies and techniques are devised to improve the chances of success or at least reduce the odds of failure.
The importance of money management to successful trading cannot be over - emphasized. In our view, it is the single most important factor in deciding whether a trader eventually succeeds or fails. Out of the financial resources available, what is the exposure or amount that a trader should have to a particular trade has a big influence in the trader's eventual performance.
The main idea behind these 2 important money management techniques of stop - loss and trailing - stop is “Let your profits run but cut your losses.”
Stop - loss means that if the price of the counter falls to a certain predetermined level, a trader should stop the losses and sell. What the actual stop - loss should be has to be determined by the trader him or herself. Setting the stop - loss levels can be more complex than what is generally realised and is dependent on a number of major factors. There is a trade off in setting a stop - loss " if it is close to your buying price, the stop - loss can be easily triggered but your loss will be small and vice - versa.
A trailing - stop is used when a counter after you have bought has gone up in price. What happens is this : Say the price has gone up from $2.00 to $3.00. To protect your profits (in case the trend turns ) and yet have a chance to participate ( in case the price still rises ), you place a trailing - stop at, say, $2.50. This means that if the price falls to $2.50, you sell out with a profit. As the price goes higher, your trailing - stops should move higher too. What the trailing - stops will be will have to be decided by each trader him or herself.
An indicator should be used in conjunction with other indicators so as to prevent false signals, which often happen.
Using technical and chart analysis requires a lot of experience, judgement and research. For those subscribers who are new, start small.
Finally, for all subscribers, do not borrow.


